A) decrease by 6 units.
B) decrease by 12 units.
C) increase by 6 units.
D) increase by 12 units.
F) A) and C)
Correct Answer

verified
Correct Answer
verified
Multiple Choice
A leftward shift of a demand curve is called an)
A) increase in demand.
B) decrease in demand.
C) decrease in quantity demanded.
D) increase in quantity demanded.
F) A) and D)
Correct Answer

verified
Correct Answer
verified
Multiple Choice
If a good is normal, then an increase in income will result in an)
A) increase in the demand for the good.
B) decrease in the demand for the good.
C) movement down and to the right along the demand curve for the good.
D) movement up and to the left along the demand curve for the good.
F) All of the above
Correct Answer

verified
Correct Answer
verified
Multiple Choice
If there is a shortage of farm laborers, we would expect
A) the wage of farm laborers to increase.
B) the wage of farm laborers to decrease.
C) the price of farm commodities to decrease.
D) a decrease in the demand for substitutes for farm labor.
F) C) and D)
Correct Answer

verified
Correct Answer
verified
Multiple Choice
Figure 4-2 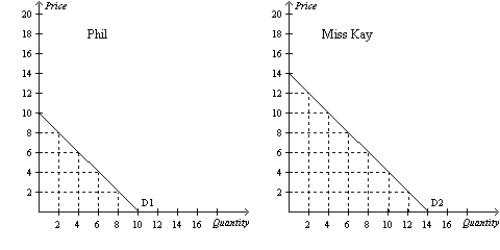 -Refer to Figure 4-2. Suppose Phil and Miss Kay are the only consumers in the market. If the price is $12, then the market quantity demanded is
A) 0 units.
B) 2 units.
C) 4 units.
D) 6 units.
F) B) and C)
Correct Answer

verified
Correct Answer
verified
Multiple Choice
If a increase in income decreases the demand for a good, then the good is an)
A) substitute good.
B) complementary good.
C) normal good.
D) inferior good.
F) None of the above
Correct Answer

verified
Correct Answer
verified
Multiple Choice
Which of the following is not a characteristic of a perfectly competitive market?
A) Sellers set the price of the product.
B) There are many sellers.
C) Buyers must accept the price the market determines.
D) All of the above are characteristics of a perfectly competitive market.
F) B) and D)
Correct Answer

verified
Correct Answer
verified
Multiple Choice
Table 4-13
The demand schedule below pertains to sandwiches demanded per week.
 -Refer to Table 4-13. Suppose Harry, Darby, and Jake are the only demanders of sandwiches. Also suppose x = 2. Then
A) the slope of Jake's demand curve is 1/2, and the slope of the market demand curve is 5/2.
B) the slope of Jake's demand curve is 1/2, and the slope of the market demand curve is 2/5.
C) the slope of Jake's demand curve is 2, and the slope of the market demand curve is 5/2.
D) the slope of Jake's demand curve is 2, and the slope of the market demand curve is 2/5.
F) A) and C)
Correct Answer

verified
Correct Answer
verified
Multiple Choice
Figure 4-27
Panel a) Panel b)
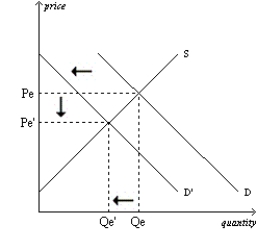
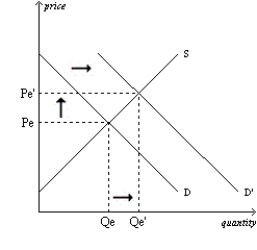 Panel c) Panel d)
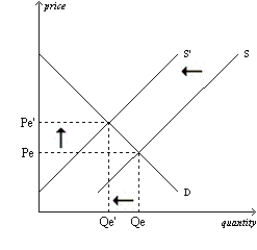
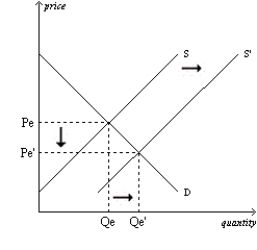 -Refer to Figure 4-27. Which of the four panels represents the market for pizza delivery in a college town as we go from summer to the beginning of the fall semester?
A) Panel a)
B) Panel b)
C) Panel c)
D) Panel d)
F) A) and C)
Correct Answer

verified
Correct Answer
verified
Multiple Choice
Table 4-8
 -Refer to Table 4-8. If these are the only three sellers in the market, then an increase in the market price from $6 to $12 will increase quantity supplied by
A) 12 units.
B) 24 units.
C) 36 units.
D) 48 units.
F) A) and C)
Correct Answer

verified
Correct Answer
verified
True/False
An increase in demand shifts the demand curve to the left.
B) False
Correct Answer

verified
Correct Answer
verified
Multiple Choice
"Other things equal, when the price of a good rises, the quantity supplied of the good also rises, and when the price falls, the quantity supplied falls as well." This relationship between price and quantity supplied
A) is referred to as the law of supply.
B) applies only to a few goods in the economy.
C) is represented by a downward-sloping supply curve.
D) All of the above are correct.
F) All of the above
Correct Answer

verified
Correct Answer
verified
Multiple Choice
Today's supply curve for gasoline could shift in response to a change in
A) today's price of gasoline.
B) the expected future price of gasoline.
C) the number of buyers of gasoline.
D) All of the above are correct.
F) All of the above
Correct Answer

verified
Correct Answer
verified
Multiple Choice
Opponents of cigarette taxes often argue that tobacco and marijuana are substitutes so that high cigarette prices
A) encourage marijuana use, and the evidence supports this argument.
B) encourage marijuana use, but the evidence does not support this argument.
C) discourage marijuana use, and the evidence supports this argument.
D) discourage marijuana use, but the evidence does not support this argument.
F) None of the above
Correct Answer

verified
Correct Answer
verified
Multiple Choice
Which of the following events must cause equilibrium quantity to rise?
A) demand increases and supply decreases
B) demand and supply both decrease
C) demand decreases and supply increases
D) demand and supply both increase
F) A) and D)
Correct Answer

verified
Correct Answer
verified
Multiple Choice
Today's demand curve for gasoline could shift in response to a change in
A) today's price of gasoline.
B) the expected future price of gasoline.
C) the number of sellers of gasoline.
D) All of the above are correct.
F) A) and C)
Correct Answer

verified
Correct Answer
verified
Multiple Choice
A decrease in the price of a good would
A) increase the supply of the good.
B) increase the quantity demanded of the good.
C) give producers an incentive to produce more to keep profits from falling.
D) shift the supply curve for the good to the left.
F) None of the above
Correct Answer

verified
Correct Answer
verified
Essay
Figure 4-28 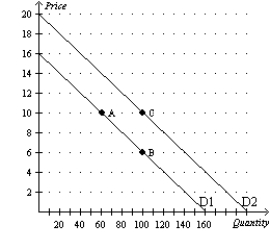 -Refer to Figure 4-28. Using the points on the figure, describe the change that would occur if the price of this good increases.
Correct Answer

verified
Correct Answer
verified
Multiple Choice
Once the demand curve for a product or service is drawn, it
A) remains stable over time.
B) can shift either rightward or leftward.
C) is possible to move along the curve, but the curve will not shift.
D) tends to become steeper over time.
F) A) and D)
Correct Answer

verified
Correct Answer
verified
Multiple Choice
Once the supply curve for a product or service is drawn, it
A) remains stable over time.
B) can shift either rightward or leftward.
C) is possible to move along the curve, but the curve will not shift.
D) tends to become steeper over time.
F) C) and D)
Correct Answer

verified
Correct Answer
verified
Showing 441 - 460 of 700
Related Exams