A) Both corrective taxes and pollution permits move the market toward the social optimum.
B) Corrective taxes move the market toward the social optimum,but pollution permits do not move the market toward the social optimum.
C) Pollution permits move the market toward the social optimum,but corrective taxes do not move the market toward the social optimum.
D) Neither corrective taxes nor pollution permits move the market toward the social optimum.
F) C) and D)
Correct Answer

verified
Correct Answer
verified
Multiple Choice
Since restored historic buildings convey a positive externality,local governments may choose to
A) regulate the demolition of them.
B) provide tax breaks to owners who restore them.
C) increase property taxes in historic areas.
D) Both a and b are correct.
F) A) and B)
Correct Answer

verified
Correct Answer
verified
Multiple Choice
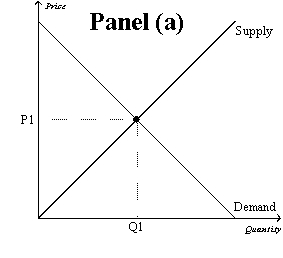
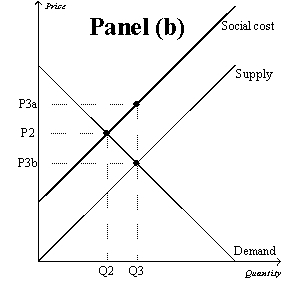
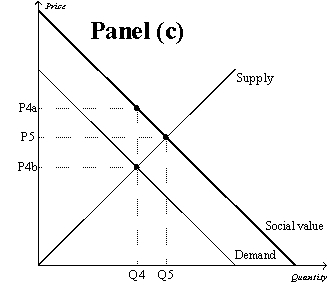
Figure 10-9 

 -Refer to Figure 10-9,Panel (b) and Panel (c) .The overuse of antibiotics leads to the development of antibiotic-resistant diseases.Therefore,the external cost of antibiotic overuse is represented by
A) Q3 - Q2.
B) Q5 - Q4.
C) P3a - P3b.
D) P4a - P4b.
F) None of the above
Correct Answer

verified
Correct Answer
verified
Multiple Choice
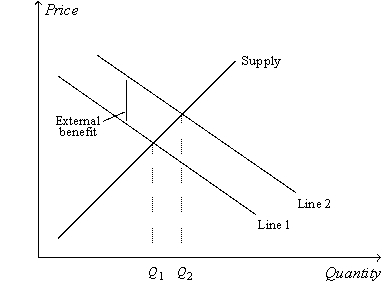
Figure 10-12  -Refer to Figure 10-12.An alternative label for the line labeled "Supply" would be
A) private value.
B) external value.
C) private cost.
D) external cost.
F) All of the above
Correct Answer

verified
Correct Answer
verified
True/False
The Coase theorem suggests that taxes should be enacted to alleviate the effects of negative externalities.
B) False
Correct Answer

verified
Correct Answer
verified
True/False
Government can be used to solve externality problems that are too costly for private parties to solve.
B) False
Correct Answer

verified
Correct Answer
verified
Multiple Choice
Suppose that smoking creates a negative externality.If the government does not interfere in the cigarette market,then
A) the equilibrium quantity of cigarettes smoked will equal the socially optimal quantity of cigarettes smoked.
B) the equilibrium quantity of cigarettes smoked will be greater than the socially optimal quantity of cigarettes smoked.
C) the equilibrium quantity of cigarettes smoked will be less than the socially optimal quantity of cigarettes smoked.
D) There is not enough information to answer the question.
F) B) and D)
Correct Answer

verified
Correct Answer
verified
Multiple Choice
Which of the following best defines the situation where one firm's research yields knowledge that is used by society as a whole?
A) social cost
B) opportunity cost of technology
C) internalization of an externality
D) technology spillover
F) B) and D)
Correct Answer

verified
Correct Answer
verified
Multiple Choice
Table 10-4
 -Refer to Table 10-4.Taking into account private and external costs,total surplus in the market equilibrium amounts to
A) $15.
B) $17.
C) $18.
D) $20.
F) All of the above
Correct Answer

verified
Correct Answer
verified
Multiple Choice
One reason that private solutions to externalities do not always work is that
A) government intervention negates the benefits of positive externalities.
B) some people benefit from externalities.
C) interested parties incur costs in the bargaining process.
D) charities are not well organized.
F) A) and C)
Correct Answer

verified
Correct Answer
verified
Multiple Choice
Figure 10-9 

 -Refer to Figure 10-9.Which graph represents a market with a negative externality?
A) Panel (a)
B) Panel (b)
C) Panel (c)
D) Both (b) and (c) are correct.
F) A) and B)
Correct Answer

verified
Correct Answer
verified
Multiple Choice
Which of the following is NOT an example of a negative externality?
A) air pollution from a manufacturing plant.
B) disrupted sleep from a neighbor's loud music.
C) an illness caused by secondhand cigarette smoke.
D) a decrease in your property value from neglecting your lawn and garden.
F) A) and C)
Correct Answer

verified
Correct Answer
verified
True/False
A congestion toll imposed on a highway driver to force the driver to take into account the increase in travel time she imposes on all other drivers is an example of internalizing the externality.
B) False
Correct Answer

verified
Correct Answer
verified
Multiple Choice
Figure 10-9 

 -Refer to Figure 10-9,Panel (b) .The market equilibrium quantity is
A) Q2,which is the socially optimal quantity.
B) Q3,which is the socially optimal quantity.
C) Q2,and the socially optimal quantity is Q3.
D) Q3,and the socially optimal quantity is Q2.
F) B) and C)
Correct Answer

verified
Correct Answer
verified
True/False
Markets sometimes fail to allocate resources efficiently.
B) False
Correct Answer

verified
Correct Answer
verified
Multiple Choice
Tradable pollution permits
A) are widely viewed as a cost-effective way to reduce pollution.
B) have helped reduce carbon emissions.
C) have helped reduce sulfur dioxide emissions.
D) All of the above are correct.
F) None of the above
Correct Answer

verified
Correct Answer
verified
Multiple Choice
Table 10-5
The following table shows the marginal costs for each of four firms (A,B,C,and D) to eliminate units of pollution from their production processes.For example,for Firm A to eliminate one unit of pollution,it would cost $54,and for Firm A to eliminate a second unit of pollution it would cost an additional $67.
 -Refer to Table 10-5.If the government wanted to reduce pollution from 16 units to 6 units,which of the following fees per unit of pollution would achieve that goal?
A) $67
B) $68
C) $81
D) $83
F) A) and B)
Correct Answer

verified
Correct Answer
verified
True/False
When firms internalize a negative externality,the market supply curve shifts to the left.
B) False
Correct Answer

verified
Correct Answer
verified
True/False
Economists believe that the optimal level of pollution is zero.
B) False
Correct Answer

verified
Correct Answer
verified
True/False
Although regulation and corrective taxes are both capable of reducing pollution,regulation accomplishes this goal more efficiently.
B) False
Correct Answer

verified
Correct Answer
verified
Showing 361 - 380 of 439
Related Exams