A) the government destroys the failing markets that caused an economic crisis.
B) innovation and enterpreneurial initiative have great power to drive economic growth.
C) economists destroy long-held beliefs about how markets function.
D) free markets need government intervention to create economic growth.
F) None of the above
Correct Answer

verified
Correct Answer
verified
Multiple Choice
Which of the following is not correct?
A) When developing economic theories,graphs offer a way to visually express ideas that might be less clear if described with equations or words.
B) Graphs are one way of expressing the relationships among variables.
C) When studying the relationship between two economic variables,graphs allow economists to draw indisputable conclusions about causes and effects.
D) When analyzing economic data,graphs provide a powerful way of finding and interpreting patterns.
F) None of the above
Correct Answer

verified
Correct Answer
verified
Multiple Choice
The opportunity cost of obtaining more of one good is shown on the production possibilities frontier as the
A) amount of the other good that must be given up.
B) market price of the additional amount produced.
C) amount of resources that must be devoted to its production.
D) number of dollars that must be spent to produce it.
F) None of the above
Correct Answer

verified
Correct Answer
verified
Multiple Choice
Which of the following statements applies to economics,as well as to other sciences such as physics?
A) Experiments are considered valid only when they are conducted in a laboratory.
B) Good theories do not need to be tested.
C) Real-world observations often lead to theories.
D) Economics,as well as other sciences,is concerned primarily with abstract concepts.
F) All of the above
Correct Answer

verified
Correct Answer
verified
Multiple Choice
Economists have helped modify the debate over the environment
A) by pointing out that nature is invaluable.
B) by focusing discussion on issues of resource allocation.
C) by lobbying Congress for acid rain legislation.
D) by arguing against tradeable permits for pollution.
F) A) and B)
Correct Answer

verified
Correct Answer
verified
True/False
A technological advance in the production of the first good increases the opportunity cost of the first good in terms of the second good.
B) False
Correct Answer

verified
Correct Answer
verified
True/False
If a major union goes on strike,then the country would be operating inside its production possibilities frontier.
B) False
Correct Answer

verified
Correct Answer
verified
True/False
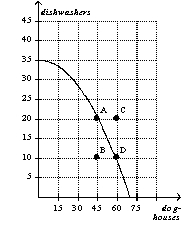
Figure 2-14  -Refer to Figure 2-14.Points A,B,and D represent feasible outcomes for this economy.
B) False
Correct Answer

verified
Correct Answer
verified
Multiple Choice
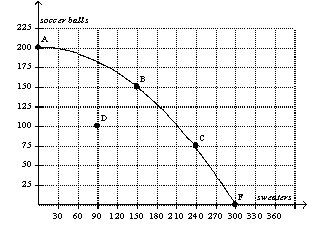
Figure 2-5  -Refer to Figure 2-5.If this economy moves from point A to point B,then which of the following statements is correct?
A) This economy has moved from a point of inefficient production to a point of efficient production.
B) This economy has experienced economic growth.
C) This economy has experienced an increase in employment.
D) None of the above is correct.
F) A) and D)
Correct Answer

verified
Correct Answer
verified
Multiple Choice
Figure 2-8
 -Refer to Figure 2-8,Panel (a) .The opportunity cost of one cup of coffee is highest when the economy produces
A) 0 cups of coffee.
B) 2 cups of coffee.
C) 4 cups of coffee.
D) 6 cups of coffee.
F) A) and D)
Correct Answer

verified
Correct Answer
verified
Multiple Choice
A relatively steep demand curve indicates that
A) quantity demanded will adjust only slightly to a price change.
B) quantity demanded will adjust significantly to a price change.
C) quantity demanded will not adjust to a price change.
D) the change in quantity demanded will exactly equal a change in price.
F) B) and C)
Correct Answer

verified
Correct Answer
verified
Multiple Choice
The inner loop of the circular-flow diagram represents the flows of inputs and outputs.Which of the following does not appear on the inner loop?
A) Wages
B) Land
C) Capital
D) Goods and services sold
F) A) and B)
Correct Answer

verified
Correct Answer
verified
Multiple Choice
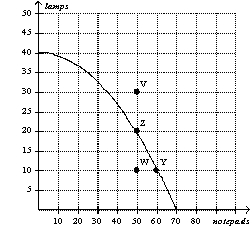
Figure 2-4  -Refer to Figure 2-4.This economy cannot currently produce 30 notepads and 45 lamps because
A) some of its resources are unemployed.
B) inefficiencies exist in this economy's production process.
C) given its current technology,it does not have the resources to produce that level of output.
D) All of the above are correct.
F) A) and C)
Correct Answer

verified
Correct Answer
verified
Multiple Choice
Normative statements are
A) descriptive.
B) claims about how the world should be.
C) claims about how the world is.
D) made by economists speaking as scientists.
F) A) and B)
Correct Answer

verified
Correct Answer
verified
Multiple Choice
Sir Isaac Newton's development of the theory of gravity after observing an apple fall from a tree is an example of
A) a controlled experiment that lead to the formulation of a scientific theory.
B) being in the right place at the right time.
C) an idea whose time had come.
D) the interplay between observation and theory in science.
F) A) and B)
Correct Answer

verified
Correct Answer
verified
Multiple Choice
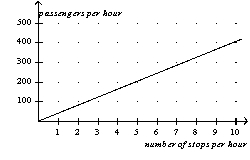
Figure 2-16
In the following graph the x-axis shows the number of times a commuter rail train stops at a station per hour and the y-axis shows the number of commuter rail passengers per hour.
Commuter Rail Passengers by Frequency of Service  -Refer to Figure 2-16.A policymaker observes this graph and concludes that increasing the frequency of commuter rail service is a certain way to get more commuters to choose the commuter rail instead of driving their own cars.You warn the policymaker about making a reverse causality mistake with which of the following statements?
A) Higher gas prices are causing more people to choose the commuter rail over driving.
B) The service frequency was increased in response to an increase in the number of passengers per hour.
C) There is a positive relationship between frequency of stops and number of passengers.
D) None of the above is correct.
F) All of the above
Correct Answer

verified
Correct Answer
verified
True/False
In economics,graphs serve two purposes: they offer a way to visually express ideas,and they provide a way of finding and interpreting patterns when analyzing economic data.
B) False
Correct Answer

verified
Correct Answer
verified
Multiple Choice
When two variables have a positive correlation,
A) when the x-variable increases,the y-variable decreases.
B) when the x-variable decreases,the y-variable increases.
C) when the x-variable increases,the y-variable increases.
D) More than one of the above is correct.
F) A) and C)
Correct Answer

verified
Correct Answer
verified
True/False
Figure 2-14  -Refer to Figure 2-14.The opportunity cost of moving from point A to point D is 10 dishwashers.
B) False
Correct Answer

verified
Correct Answer
verified
True/False
According to John Maynard Keynes,an economist must possess a rare combination of skills including being a mathematician,historian,statesman,and philosopher.
B) False
Correct Answer

verified
Correct Answer
verified
Showing 121 - 140 of 530
Related Exams