A) lead to losses in surplus for consumers and for producers that, when taken together, exceed tax revenue collected by the government.
B) distort incentives to both buyers and sellers.
C) prevent buyers and sellers from realizing some of the gains from trade.
D) All of the above are correct.
F) A) and C)
Correct Answer

verified
Correct Answer
verified
Multiple Choice
The Social Security tax is a tax on
A) capital.
B) labor.
C) consumption expenditures.
D) earnings during retirement.
F) A) and D)
Correct Answer

verified
Correct Answer
verified
Multiple Choice
When a tax is levied on the buyers of a good, the
A) supply curve shifts upward by the amount of the tax.
B) quantity supplied increases for all conceivable prices of the good.
C) buyers of the good will send tax payments to the government.
D) demand curve shifts to the right by the horizontal distance of the tax.
F) A) and C)
Correct Answer

verified
Correct Answer
verified
Multiple Choice
When a tax is imposed on a good for which the supply is relatively elastic and the demand is relatively inelastic,
A) buyers of the good will bear most of the burden of the tax.
B) sellers of the good will bear most of the burden of the tax.
C) buyers and sellers will each bear 50 percent of the burden of the tax.
D) both equilibrium price and quantity will increase.
F) A) and D)
Correct Answer

verified
Correct Answer
verified
Multiple Choice
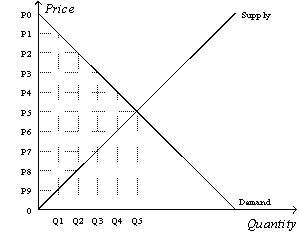
Figure 8-10  -Refer to Figure 8-10. Suppose the government imposes a tax that reduces the quantity sold in the market after the tax to Q2. The price that buyers pay is
A) P0.
B) P2.
C) P5.
D) P8.
F) A) and B)
Correct Answer

verified
Correct Answer
verified
Multiple Choice
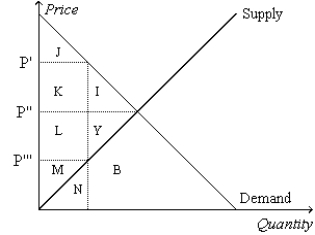
Figure 8-1  -Refer to Figure 8-1. Suppose the government imposes a tax of P' - P'''. The area measured by J+K+I represents
A) consumer surplus after the tax.
B) consumer surplus before the tax.
C) producer surplus after the tax.
D) producer surplus before the tax.
F) None of the above
Correct Answer

verified
Correct Answer
verified
Multiple Choice
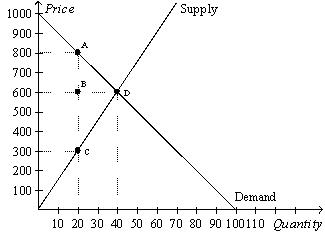
Figure 8-9
The vertical distance between points A and C represent a tax in the market.  -Refer to Figure 8-9. The loss of consumer surplus as a result of the tax is
A) $2,000.
B) $4,000.
C) $6,000.
D) $8,000.
F) B) and C)
Correct Answer

verified
Correct Answer
verified
True/False
The more elastic the supply, the larger the deadweight loss from a tax, all else equal.
B) False
Correct Answer

verified
Correct Answer
verified
Multiple Choice
For a good that is taxed, the area on the relevant supply-and-demand graph that represents government's tax revenue is a
A) triangle.
B) rectangle.
C) trapezoid.
D) None of the above is correct; government's tax revenue is the area between the supply and demand curves, above the horizontal axis, and below the effective price to buyers.
F) A) and B)
Correct Answer

verified
Correct Answer
verified
True/False
The Social Security tax is a labor tax.
B) False
Correct Answer

verified
Correct Answer
verified
Multiple Choice
Suppose the government increases the size of a tax by 40 percent. The deadweight loss from that tax
A) increases by 40 percent.
B) increases by more than 40 percent.
C) increases but by less than 40 percent.
D) decreases by 40 percent.
F) A) and C)
Correct Answer

verified
Correct Answer
verified
Multiple Choice
If the labor supply curve is nearly vertical, a tax on labor
A) has a large deadweight loss.
B) raises a small amount of tax revenue.
C) has little impact on the amount of work that workers are willing to do.
D) results in a large tax burden on the firms that hire labor.
F) B) and C)
Correct Answer

verified
Correct Answer
verified
Multiple Choice
Figure 8-9
The vertical distance between points A and C represent a tax in the market.  -Refer to Figure 8-9. The loss of producer surplus as a result of the tax is
A) $3,000.
B) $6,000.
C) $9,000.
D) $12,000.
F) A) and C)
Correct Answer

verified
Correct Answer
verified
Multiple Choice
Andre walks Julia's dog once a day for $50 per week. Julia values this service at $60 per week, while the opportunity cost of Andre's time is $30 per week. The government places a tax of $35 per week on dog walkers. Before the tax, what is the total surplus?
A) $60
B) $50
C) $30
D) $25
F) B) and C)
Correct Answer

verified
Correct Answer
verified
Multiple Choice
Suppose a tax of $1 per unit is imposed on a good. The more elastic the supply of the good, other things equal, the
A) smaller is the response of quantity supplied to the tax.
B) larger is the tax burden on sellers relative to the tax burden on buyers.
C) larger is the deadweight loss of the tax.
D) All of the above are correct.
F) None of the above
Correct Answer

verified
Correct Answer
verified
Multiple Choice
In the market for widgets, the supply curve is the typical upward-sloping straight line, and the demand curve is the typical downward-sloping straight line. The equilibrium quantity in the market for widgets is 200 per month when there is no tax. Then a tax of $5 per widget is imposed. As a result, the government is able to raise $750 per month in tax revenue. We can conclude that the equilibrium quantity of widgets has fallen by
A) 25 per month.
B) 50 per month.
C) 75 per month.
D) 100 per month.
F) A) and B)
Correct Answer

verified
Correct Answer
verified
Multiple Choice
If T represents the size of the tax on a good and Q represents the quantity of the good that is sold, total tax revenue received by government can be expressed as
A) T/Q.
B) T+Q.
C) TxQ.
D) (TxQ) /Q.
F) B) and D)
Correct Answer

verified
Correct Answer
verified
Multiple Choice
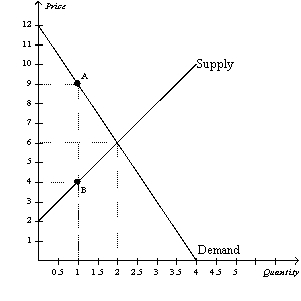
Figure 8-2
The vertical distance between points A and B represents a tax in the market.  -Refer to Figure 8-2. The loss of producer surplus for those sellers of the good who continue to sell it after the tax is imposed is
A) $0.
B) $1.
C) $2.
D) $3.
F) A) and D)
Correct Answer

verified
Correct Answer
verified
Multiple Choice
Which of the following statements is correct?
A) A decrease in the size of a tax always decreases the tax revenue raised by that tax.
B) A decrease in the size of a tax always decreases the deadweight loss of that tax.
C) Tax revenue decreases when there is a small decrease in the tax rate and the economy is on the downward-sloping part of the Laffer curve.
D) An increase in the size of a tax leads to an increase in the deadweight loss of the tax only if the economy is on the upward-sloping part of the Laffer curve.
F) C) and D)
Correct Answer

verified
Correct Answer
verified
True/False
The elasticities of the supply and demand curves in the market for cigarettes affect how much a tax distorts that market.
B) False
Correct Answer

verified
Correct Answer
verified
Showing 321 - 340 of 422
Related Exams