A) 750.
B) 1,000.
C) 1,250.
D) 1,500.
F) B) and D)
Correct Answer

verified
Correct Answer
verified
Multiple Choice
Figure 9-16. The figure below illustrates a tariff. On the graph, Q represents quantity and P represents price.
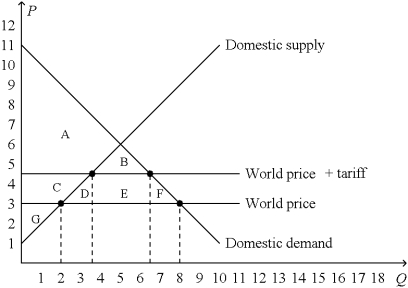 -Refer to Figure 9-16.The tariff
A) decreases producer surplus by the area C, decreases consumer surplus by the area C + D + E, and decreases total surplus by the area D + F.
B) increases producer surplus by the area C, decreases consumer surplus by the area C + D + E + F, and decreases total surplus by the area D + F.
C) creates government revenue represented by the area B + E and decreases total surplus by the area D + E + F.
D) increases producer surplus by the area C + G and creates government revenue represented by the area D + E + F.
F) A) and B)
Correct Answer

verified
Correct Answer
verified
Multiple Choice
Figure 9-13
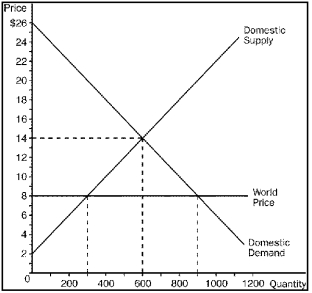 -Refer to Figure 9-13.With trade,domestic production and domestic consumption,respectively,are
A) 600 and 600.
B) 600 and 300.
C) 300 and 900.
D) 600 and 900.
F) B) and C)
Correct Answer

verified
Correct Answer
verified
Multiple Choice
Figure 9-12
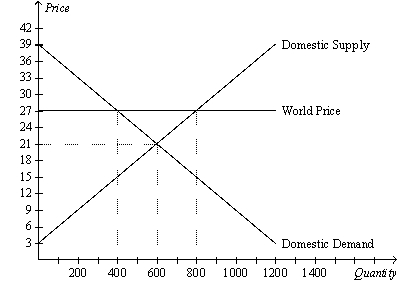 -Refer to Figure 9-12.With trade,domestic production and domestic consumption,respectively,are
A) 600 and 400.
B) 800 and 400.
C) 400 and 600.
D) 400 and 800.
F) A) and C)
Correct Answer

verified
Correct Answer
verified
Multiple Choice
A common argument in favor of restricting international trade in good x is based on the premise that
A) international trade reduces total surplus in countries that export good x.
B) international trade reduces total surplus in countries that import good x.
C) international trade is desirable only when countries with different domestic supplies of natural resources play by different rules when trading with one another.
D) trade restrictions can be useful when one country bargains with its trading partners.
F) All of the above
Correct Answer

verified
Correct Answer
verified
True/False
When a country that imports shoes imposes a tariff on shoes,buyers of shoes in that country become worse off and sellers of shoes in that country become better off.
B) False
Correct Answer

verified
Correct Answer
verified
Multiple Choice
What is the fundamental basis for trade among nations?
A) shortages or surpluses in nations that do not trade
B) misguided economic policies
C) absolute advantage
D) comparative advantage
F) A) and C)
Correct Answer

verified
Correct Answer
verified
Multiple Choice
Domestic producers of a good become better off,and domestic consumers of a good become worse off,when a country begins allowing international trade in that good and
A) the country becomes an importer of the good as a result.
B) the world price exceeds the domestic price of the good that prevailed before international trade was allowed.
C) other countries have a comparative advantage, relative to the country in question, in producing the good.
D) total surplus does not change as a result.
F) None of the above
Correct Answer

verified
Correct Answer
verified
Multiple Choice
Figure 9-19. On the diagram below, Q represents the quantity of textiles and P represents the price of textiles.
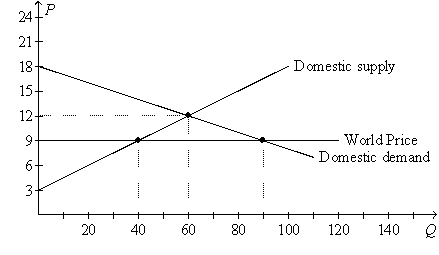 -Refer to Figure 9-19.With free trade,consumer surplus in the textile market amounts to
A) $210.
B) $320.
C) $405.
D) $910.
F) A) and D)
Correct Answer

verified
Correct Answer
verified
Multiple Choice
Trade enhances the economic well-being of a nation in the sense that
A) both domestic producers and domestic consumers of a good become better off with trade, regardless of whether the nation imports or exports the good in question.
B) the gains of domestic producers of a good exceed the losses of domestic consumers of a good, regardless of whether the nation imports or exports the good in question.
C) trade results in an increase in total surplus.
D) trade puts downward pressure on the prices of all goods.
F) B) and C)
Correct Answer

verified
Correct Answer
verified
Multiple Choice
Figure 9-11
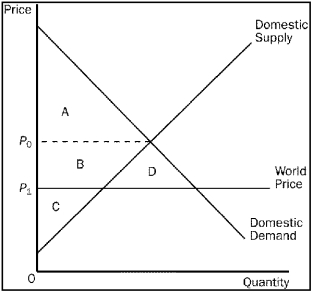 -Refer to Figure 9-11.Consumer surplus in this market after trade is
A) A.
B) C + B.
C) A + B + D.
D) B + C + D.
F) B) and C)
Correct Answer

verified
Correct Answer
verified
True/False
NAFTA is an example of a multilateral approach to achieving free trade.
B) False
Correct Answer

verified
Correct Answer
verified
Multiple Choice
If the world price of sugar is lower than Brazil's domestic price of sugar without trade,then Brazil
A) should import sugar.
B) has a comparative advantage in sugar.
C) should produce just enough sugar to satisfy domestic demand.
D) should produce no sugar domestically.
F) B) and C)
Correct Answer

verified
Correct Answer
verified
True/False
Free trade causes job losses in industries in which a country does not have a comparative advantage,but it also causes job gains in industries in which the country has a comparative advantage.
B) False
Correct Answer

verified
Correct Answer
verified
Multiple Choice
The world price of a ton of steel is $1,000.Before Russia allowed trade in steel,the price of a ton of steel there was $650.Once Russia allowed trade in steel with other countries,Russia began
A) exporting steel and the price per ton in Russia remained at $650.
B) exporting steel and the price per ton in Russia increased to $1,000.
C) importing steel and the price per ton in Russia remained at $650.
D) importing steel and the price per ton in Russia increased to $1,000.
F) All of the above
Correct Answer

verified
Correct Answer
verified
Multiple Choice
Figure 9-3. The domestic country is China.
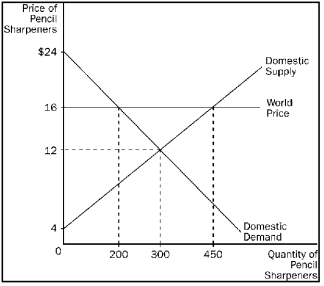 -Refer to Figure 9-3.With trade,producer surplus in China is
A) $800.
B) $1,200.
C) $1,800.
D) $2,700.
F) All of the above
Correct Answer

verified
Correct Answer
verified
Multiple Choice
Figure 9-5
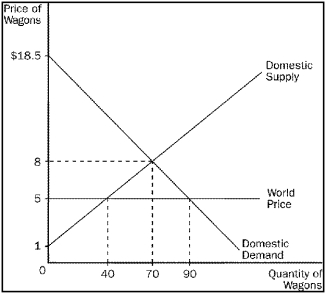 -Refer to Figure 9-5.Total surplus with trade exceeds total surplus without trade by
A) $60.
B) $75.
C) $135.
D) $210.
F) B) and D)
Correct Answer

verified
Correct Answer
verified
Multiple Choice
Import quotas and tariffs produce some common results.Which of the following is not one of those common results?
A) Total surplus in the domestic country falls.
B) Producer surplus in the domestic country increases.
C) The domestic country experiences a deadweight loss.
D) Revenue is raised for the domestic government.
F) All of the above
Correct Answer

verified
Correct Answer
verified
Multiple Choice
Figure 9-8. On the diagram below, Q represents the quantity of cars and P represents the price of cars.
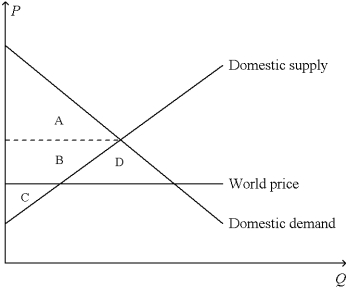 -Refer to Figure 9-8.In the country for which the figure is drawn,total surplus with international trade in cars
A) is represented by the area A + B + C.
B) is represented by the area A + B + D.
C) is smaller than producer surplus without international trade in cars.
D) is larger than total surplus without international trade in cars.
F) A) and C)
Correct Answer

verified
Correct Answer
verified
Multiple Choice
Figure 9-15
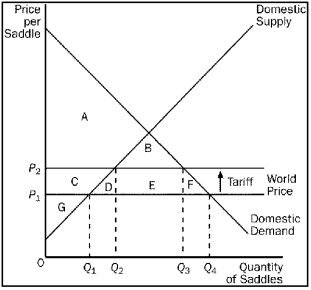 -Refer to Figure 9-15.With the tariff,the domestic price and domestic quantity demanded are
A) P1 and Q1.
B) P1 and Q4.
C) P2 and Q2.
D) P2 and Q3.
F) A) and B)
Correct Answer

verified
Correct Answer
verified
Showing 41 - 60 of 410
Related Exams